Periods of elevated market volatility are usually framed as a headwind for equities, and the concern is sharpest for new stocks, or stocks within the first three years after an initial public offering (IPO). Their track records are short, analyst coverage is thin, and their shareholder bases are still forming. When markets sell off, these are often the names that fall first and hardest.
That reputation is not wrong, but rather incomplete. Volatility is essential for price discovery, separating durable businesses from fragile ones. And historically, it has often preceded strong forward returns in the new stock asset class.
This study examines how the Renaissance IPO ETF (ticker: IPO) behaved across distinct volatility regimes over the seven-year period from 2019 through 2025. This window captures major volatility events like the 2020 COVID crash, the 2022 global sell-off, and the 2025 tariff shock.
Key Takeaways
- Volatility has historically preceded strong forward returns. In the six months following the onset of a high-volatility regime, the Renaissance IPO ETF returned an average of 18.4%, versus 12.0% for the S&P 500, an outperformance of more than 6 percentage points.
- The drawdowns were more severe, but exposure captured asymmetric upside. In the high-volatility regime, the IPO ETF fell much harder than the market, with a maximum drawdown of -67.7% versus -33.7% for the S&P 500. However, it captured 326.7% of market upside against 102.1% of downside in that same regime.
- Volatility widened the gap between winners and losers. Cross-sectional dispersion among holdings rose from 2.9% in the low-volatility regime to 4.1% in the high regime, while the share of names diverging sharply from the pack more than doubled, from 1.2% to 2.5%, a signal of price discovery.
- The exposure behaved as a distinct, high-beta sleeve. Across regimes, the IPO ETF consistently captured asymmetric upside but also carried materially higher volatility than the market, evidenced by a 12-month rolling standard deviation of 27.4-39.4% versus 14.6-24.2% for the S&P 500.
This study seeks to answer not whether newly public stocks are volatile, but whether that volatility is better understood as a risk to be minimized or an entry signal to be sized and managed.
Past performance does not guarantee future results. The performance data quoted represents past performance and current returns may be lower or higher. The investment return and principal value of an investment will fluctuate so that an investor's shares, when redeemed, may be worth more or less than the original cost. For performance to the most recent month end, and standardized performance, please click here. Short-term performance has benefited from unusually favorable market conditions that may not be sustainable and such performance may not be repeatable in the future.
Establishing the Backdrop: Volatility Regimes & Select Benchmarks
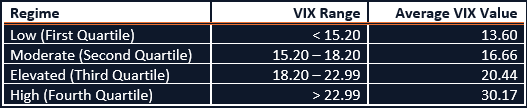
Defining volatility regimes. To evaluate the impact of volatility, we look at implied levels over the 2019-2025 period, based on the CBOE Volatility Index (VIX). We establish four regimes based on quartile observations:
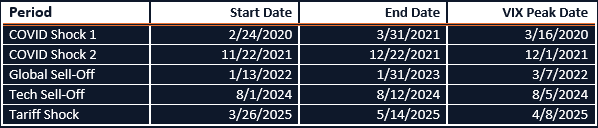
Periods of interest. For the purpose of this study, we look at periods of extended stress, which we define as an elevated or high volatility regime for 7+ consecutive trading days, with a peak VIX surpassing the 90th percentile. We identify five periods that fit this definition:
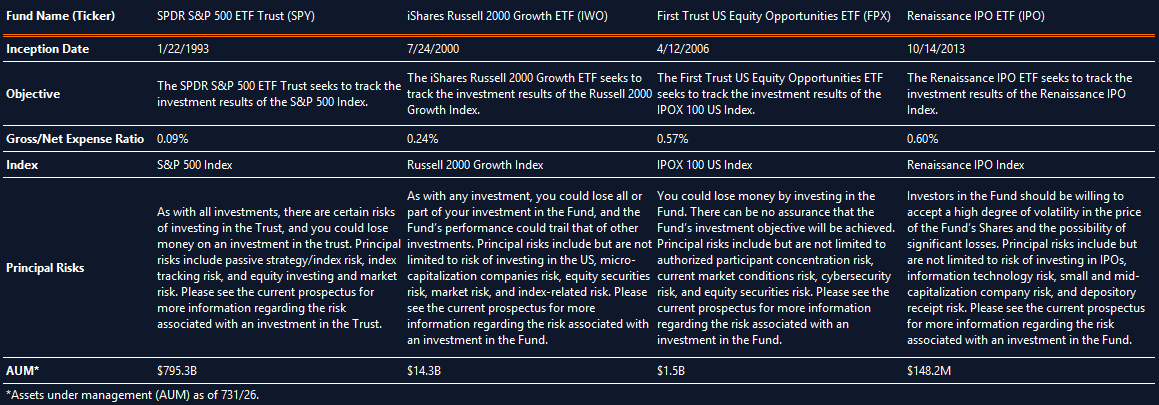
Benchmarks. We look at the IPO ETF alongside three benchmarks:
- SPDR S&P 500 ETF Trust (SPY): large-cap, broad market baseline
- iShares Russell 2000 Growth ETF (IWO): small-cap growth mimicking the size profile of many IPOs
- First Trust US Equity Opportunities ETF (FPX): similar new stock-focused strategy
All funds are managed differently and do not react the same to economic or market events. This article does not aim to make direct fund-to-fund comparisons. The investment objectives, strategies, policies, or restrictions of other funds may differ and more information can be found in their respective prospectuses. Therefore, we generally do not believe it is possible to make direct fund to fund comparisons in an effort to highlight the benefits of a fund versus another similarly managed fund.
Shares are bought and sold at market price (not NAV) and are not individually redeemed from the Fund. Total Returns are calculated using the daily 4:00pm net asset value (NAV). Market price returns reflect the midpoint of the bid/ask spread as of the close of trading on the exchange where Fund shares are listed. Market price returns do not represent the returns you would receive if you traded shares at other times.
Regime Analysis: The Core Findings
The core of this study is based on four areas of analysis: contemporaneous and forward returns by regime, the risk characteristics that accompany those returns, and the dispersion that reveals price discovery at work.
A. Return Behavior by Volatility Regime
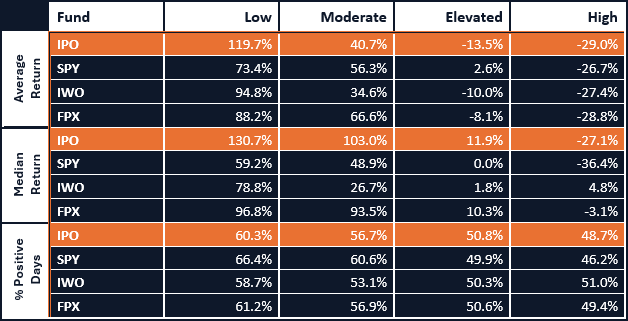
Source: Renaissance Capital, based on data from Yahoo Finance as of 6/30/26. Figures for the 7-year period ended 12/31/25. Average and median return figures based on daily returns within each regime, annualized (geometric). Percent positive days are percentage of days with positive daily returns within each regime. Past performance is no guarantee of future results. Month end returns and SEC Standardized Performance can be found by clicking here. Table includes Renaissance IPO ETF (IPO; Gross/Net Expense Ratio: 0.60%); SPDR S&P 500 ETF Trust (SPY; Gross/Net Expense Ratio: 0.09%); iShares Russell 2000 Growth ETF (IWO; Gross/Net Expense Ratio: 0.24%); First Trust US Equity Opportunities ETF (FPX; Gross/Net Expense Ratio: 0.57%).
The raw returns reflect conventional expectations. The IPO ETF’s annualized average and median returns fall steadily as volatility rises, from 119.7%/130.7% in the low regime to -29.0%/-27.1% in the high regime, respectively. It’s a steeper decline than any of the comparative benchmarks; new stocks bear the brunt of turbulence while it is happening.
We believe it’s worth noting, though, that the IPO ETF’s median return sits above its mean in every regime, reflecting a left-skewed distribution where large losses drag the average down despite more positive performance from the typical holding. The losses are real, but they are concentrated in the tails and in the average rather than the typical trading day.
B. Forward Returns After High Volatility Periods
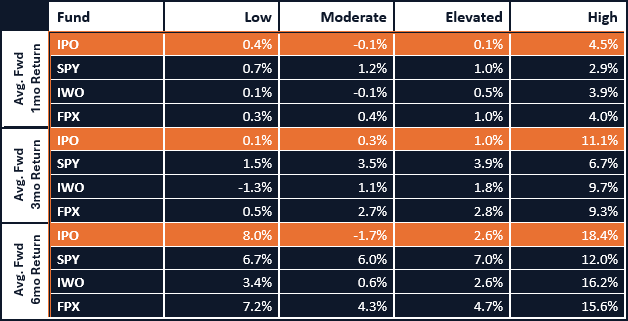
Source: Renaissance Capital, based on data from Yahoo Finance as of 6/30/26. Figures for the 7-year period ended 12/31/25. Average forward return figures based on returns from the onset of each day within the specified regime. Past performance is no guarantee of future results. Table includes Renaissance IPO ETF (IPO; Gross/Net Expense Ratio: 0.60%); SPDR S&P 500 ETF Trust (SPY; Gross/Net Expense Ratio: 0.09%); iShares Russell 2000 Growth ETF (IWO; Gross/Net Expense Ratio: 0.24%); First Trust US Equity Opportunities ETF (FPX; Gross/Net Expense Ratio: 0.57%).
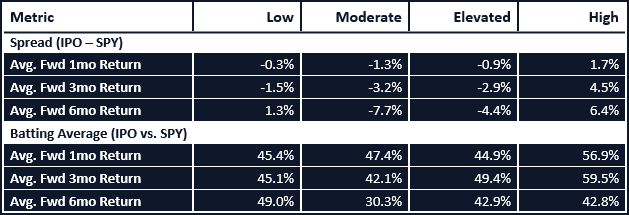
Source: Renaissance Capital, based on data from Yahoo Finance as of 6/30/26. Figures for the 7-year period ended 12/31/25. Spread is the difference between IPO and SPY forward returns for each period within each regime. Batting average is the percentage of days IPO outperformed SPY on a forward basis within each regime. Past performance is no guarantee of future results. Table includes Renaissance IPO ETF (IPO; Gross/Net Expense Ratio: 0.60%); SPDR S&P 500 ETF Trust (SPY; Gross/Net Expense Ratio: 0.09%).
In the low, moderate, and elevated regimes, new stock exposure yielded forward returns mostly in line with or below the broader market; the IPO ETF trailed the S&P 500 in almost every return window across the three regimes, with forward spreads running as wide as -7.7 percentage points.
The relationship inverts in periods of higher volatility. Following the onset of a high-volatility regime, the IPO ETF outpaced all three comparative benchmarks. It outperformed the S&P by +1.7, +4.5, and +6.4 percentage points over the next 1, 3, and 6 months, respectively, and did so more than half the time, with batting averages of 56.9% and 59.5% for the 1- and 3-month horizons.
The data shows that while the forward premium is not a general feature of the new stock asset class, periods of high volatility provide an entry signal that may allow investors to capture greater upside.
C. Risk Characteristics
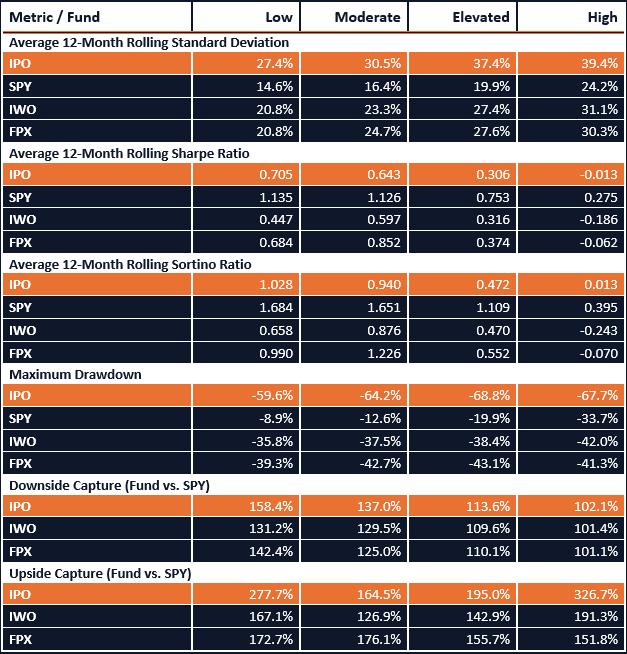
Source: Renaissance Capital, based on data from Yahoo Finance as of 6/30/26. Figures for the 7-year period ended 12/31/25. Standard deviation of returns measures the amount a return series deviates from its mean, averaged within each regime. Sharpe ratio is a measure that uses standard deviation and the excess return over a specified risk free rate to determine reward per unit of risk, averaged within each regime. Sortino ratio is a measure that uses downside deviation and the excess return over a specified target rate to determine reward per unit of risk, averaged within each regime. Maximum drawdown measures the largest single percentage drop from peak to trough within each regime. Downside capture measures losses compared to SPY during periods of negative SPY returns within each regime. Upside capture measures gains compared to SPY during periods of positive SPY returns within each regime. Past performance is no guarantee of future results. Table includes Renaissance IPO ETF (IPO; Gross/Net Expense Ratio: 0.60%); SPDR S&P 500 ETF Trust (SPY; Gross/Net Expense Ratio: 0.09%); iShares Russell 2000 Growth ETF (IWO; Gross/Net Expense Ratio: 0.24%); First Trust US Equity Opportunities ETF (FPX; Gross/Net Expense Ratio: 0.57%).
The risk characteristics reveal a punishing path for new stocks in periods of market turbulence. The IPO ETF had the highest volatility of any fund in every regime, peaking at 39.4% in high volatility. Its Sharpe and Sortino ratios sat below SPY’s throughout, and its maximum drawdowns were the most extreme among the compared funds. These metrics show clear risk, but the capture ratios reveal upside that may be worth the risk.
As volatility rises, the IPO ETF’s downside capture declines (102.1% in the high regime vs. 158.4% in the low regime), while its upside capture remains strong (326.7% in the high regime). This indicates that the IPO ETF may stop falling faster than the broader market in periods of high stress while retaining outsized rebound potential.
It’s worth noting that behind the asymmetric upside, the risk metrics ultimately show that the IPO ETF is a more volatile, aggressive investment than broad market funds. The upside capture is greater than the downside capture across all regimes, indicating an investment suited for those with high risk tolerance and a long time horizon.
D. Dispersion & Price Discovery

Source: Renaissance Capital, based on data from Yahoo Finance as of 6/30/26. Figures for the 7-year period ended 12/31/25. Standard deviation of holding daily returns measures the standard deviation of holding returns within a day, averaged within each regime. 90th-10th percentile spread measures the difference in daily return between the 90th and 10th percentile holdings, averaged within each regime. Fat-tail share measures the percentage of holdings whose daily returns diverge ±10% from the mean, averaged within each regime. Past performance is no guarantee of future results. Table includes Renaissance IPO ETF (IPO; Gross/Net Expense Ratio: 0.60%); SPDR S&P 500 ETF Trust (SPY; Gross/Net Expense Ratio: 0.09%); iShares Russell 2000 Growth ETF (IWO; Gross/Net Expense Ratio: 0.24%); First Trust US Equity Opportunities ETF (FPX; Gross/Net Expense Ratio: 0.57%).
This section digs into the study’s central claim that volatility drives differentiation, not just decline. If volatility is doing price-discovery work, the gap between the best- and worst-performing holdings should widen as volatility rises, and more names should break away from the pack.
All three measures move the same way and in one direction. From the low to the high regime, average standard deviation of holding daily returns climbs from 2.9% to 4.1%, the 90th-10th percentile spread widens from 5.5 to 8.0 percentage points, and the fat-tail share increases from 1.2% to 2.5%. The agreement across these three metrics indicates that rising volatility does not simply push every new stock down together, it pulls them apart, widening the distance between the top and bottom names. This is evidence of price discovery and signals that turbulence in new stocks can be a mechanism rather than simply a hazard.
Period Analysis: Regime Dynamics Through Periods of Interest
Across the seven defined periods, a clear dividing line emerges. In sharp, isolated shocks that arrived and resolved fast, the IPO ETF tended to rebound harder than the market and recover in a similar or shorter window than the other benchmarks. In the slower, inflationary and rate-driven repricings of late 2021 and 2022, it fell further and stayed down. From this, we see that the character of the volatility matters in the new stock asset class. Short-term dislocations and regime-changing macro shifts have not created the same opportunities.
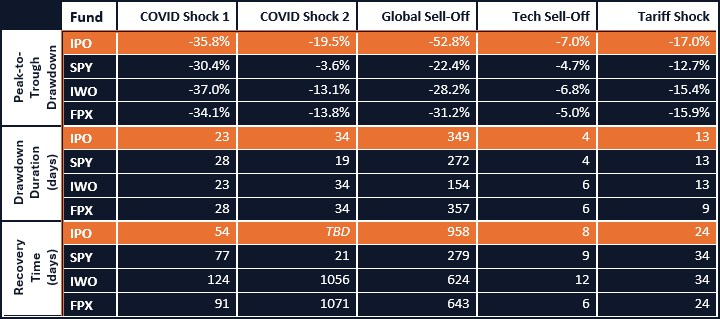
Source: Renaissance Capital, based on data from Yahoo Finance as of 6/30/26. Peak-to-trough drawdown measures the largest drawdown in the defined period. Drawdown duration measures the number of calendar days from the start of the defined period to the trough. Recovery time measures the number of calendar days from the date of the trough in the defined period to the next date at or above the fund value at the start of the defined period. Past performance is no guarantee of future results. Table includes Renaissance IPO ETF (IPO; Gross/Net Expense Ratio: 0.60%); SPDR S&P 500 ETF Trust (SPY; Gross/Net Expense Ratio: 0.09%); iShares Russell 2000 Growth ETF (IWO; Gross/Net Expense Ratio: 0.24%); First Trust US Equity Opportunities ETF (FPX; Gross/Net Expense Ratio: 0.57%).
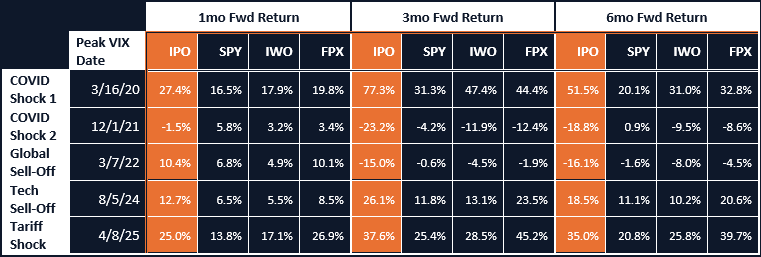
Source: Renaissance Capital, based on data from Yahoo Finance as of 6/30/26. Forward return figures based on returns from the date of the peak VIX level within the defined period. Past performance is no guarantee of future results. Table includes Renaissance IPO ETF (IPO; Gross/Net Expense Ratio: 0.60%); SPDR S&P 500 ETF Trust (SPY; Gross/Net Expense Ratio: 0.09%); iShares Russell 2000 Growth ETF (IWO; Gross/Net Expense Ratio: 0.24%); First Trust US Equity Opportunities ETF (FPX; Gross/Net Expense Ratio: 0.57%).
Limitations & Considerations for Prospective Investors
Below we highlight some limitations that should be weighed alongside the data presented:
- Sample period length and dynamics. The seven-year sample period may contain a limited number of true high-volatility episodes. The COVID and post-COVID periods (2020-2022) in particular represent a sizable portion of VIX observations in the elevated- and high-volatility regimes.
- Regime independence and sensitivity. Regimes often overlap and cluster rather than occurring independently. While we believe our methodology is sound, conclusions depend on where the volatility thresholds are drawn.
Investing in newly-public companies involves risks. IPOs can experience price volatility due to market sentiment, limited financial histories, and events such as lock-up period expirations, which may allow insiders to sell shares. External factors, including interest rate changes or regulatory developments, may also affect IPO performance.
The IPO ETF is designed for growth-oriented investors who believe in the long-term potential of innovative, newly-public companies. It may be a good fit for:
- Investors seeking exposure to high-growth and disruptive companies in sectors like technology, consumer innovation, and healthcare.
- Those looking to diversify their portfolios with an asset class that complements traditional large-cap or value-focused funds.
- Financial advisors building portfolios for clients with a higher risk tolerance and long-term investment horizons.
The new stock asset class may represent a portion (i.e., 5-10%) of a diversified portfolio, complementing large-cap or value-focused investments, depending on an investor’s objectives and risk profile.
Takeaways & Conclusion
This study seeks to reframe a familiar assumption. Volatility is a real source of risk for new stocks, but in the period between 2019 and 2025, volatility also functioned as a mechanism of price discovery, preceding some of the strongest forward returns among the compared benchmarks.
Three practical lessons follow:
- Volatility can be an entry signal rather than an exit trigger. The forward premium in new stocks was specific to high-volatility regimes. This can be interpreted as a reward for stepping in, not a reason to step out, even though that is when investors often seek to reduce exposure. Over this period, volatility-driven selling tended to lock in the drawdown and forfeit the recovery.
- Sizing volatility correctly is crucial to survival. The rebounds we examined were only realized by investors who were able to hold through severe drawdowns without being forced to sell. Key exposure may resemble a deliberately sized satellite or thematic sleeve where volatility is a feature the portfolio can tolerate, supported by rebalancing discipline that adds rather than trims into weakness.
- Read the character of the volatility. Not every dislocation is an opportunity. Sharp, isolated shocks have historically been valid entry points; persistent, rate-driven repricings have not. The distinction matters more than the VIX level itself.
These findings do not support a strategy focused on buying every dip or chasing the most speculative names. They advocate for treating turbulence as the normal cost of new stock exposure, sizing it appropriately, and recognizing it as a signal that must be read. For investors willing to size the exposure deliberately and hold through discomfort, volatility has been less a warning than an invitation and, historically, one of the clearest entry points the new stock asset class may offer.
Investments in the Renaissance IPO ETF, symbol “IPO”, are subject to investment risk, including possible loss of the principal amounts invested. The ETF invests in companies that have recently completed initial public offerings. These stocks are unseasoned equities lacking trading history, a track record of reporting to investors and widely available research coverage which may result in extreme price volatility. Due to a greater number of IPOs in certain segments, the ETF may also be subject to information technology and financial sector risk, and small and mid-capitalization company risk. The ETF may hold securities in the form of Depository Receipts, REITs, and Partnership Units, which have greater risks than common shares. The strategies have high portfolio turnover and securities lending risks. The returns of the ETF may not match the return of the index. The ETF is classified as non-diversified investment companies subject to concentration risk. Diversification does not guarantee a profit or protect against a loss.
For a prospectus and/or summary prospectus with this and other information, please visit the document center at etfs.renaissancecapital.com. Investors should read the prospectus and consider the investment objectives, risks, charges and expenses carefully before investing.
For additional information, contact Foreside Fund Services, LLC, distributor, at 1-866-486-6645.
More information about the other funds mentioned can be obtained by clicking on the links below for standardized performance, performance to the most recent month end, prospectus and additional risk information.
- First Trust US Equity Opportunities ETF (FPX)
- iShares Russell 2000 Growth ETF (IWO)
- State Street® SPDR® S&P 500® ETF Trust (SPY)
Definitions
CBOE Volatility Index (VIX): The VIX is a measure of the market's expectation of 30-day future volatility for the S&P 500 Index, derived from S&P 500 options prices. The index is not available for direct investment.