Despite a solid summer, the initial public offering (IPO) market stumbled in the third quarter of 2026 amid wobbling macroeconomic conditions. More concerns about AI spending, a 19-year high in bond yields in the US, and a shift in global interest rate expectations weighed on fall IPO activity, which came in below expectations. Global benchmarks saw some volatility but mostly traded sideways, while weakened appetite for growth stocks hammered the new stock asset class. As a result, both the Renaissance IPO ETF and the Renaissance International IPO ETF ended the quarter down, underperforming broader equity benchmarks.
Performance Snapshot
Below we highlight third quarter performance of the Renaissance IPO ETF (NYSE: IPO) and the Renaissance International IPO ETF (NYSE: IPOS). We frame this against the performance of the SPDR S&P 500 ETF Trust (SPY) and the iShares MSCI ACWI ex US ETF (ACWX), respectively, as well as the IPO ETFs’ underlying indices, the Renaissance IPO Index (IPOUSA) and the Renaissance International IPO Index (IPOXUS).
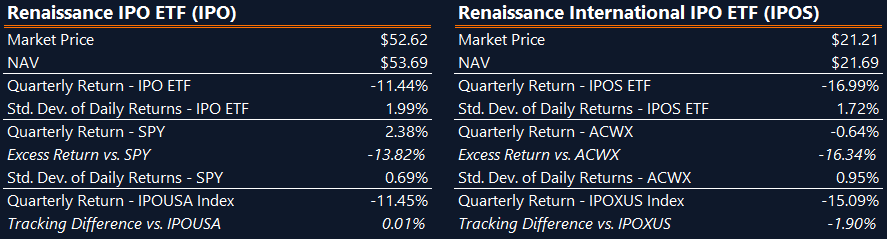
Source: Renaissance Capital, based on data from Yahoo Finance as of 9/30/26. Figures for the quarter ended 9/30/26. Returns based on market price. Standard deviation reflects the standard deviation of daily returns during the quarter. Past performance does not guarantee future results. The performance data quoted represents past performance and current returns may be lower or higher. The investment return and principal value of an investment will fluctuate so that an investor's shares, when redeemed, may be worth more or less than the original cost. For the most recent standardized quarter end and month end performance for each fund, please click here (IPO) (IPOS) (SPY) (ACWX).
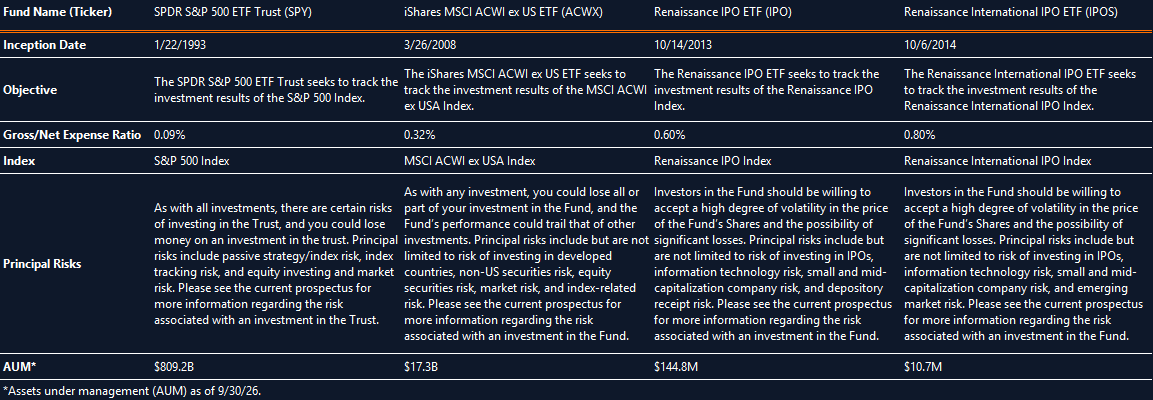
All funds are managed differently and do not react the same to economic or market events. This article does not aim to make direct fund-to-fund comparisons. The investment objectives, strategies, policies, or restrictions of other funds may differ and more information can be found in their respective prospectuses. Therefore, we generally do not believe it is possible to make direct fund to fund comparisons in an effort to highlight the benefits of a fund versus another similarly managed fund.
Shares are bought and sold at market price (not NAV) and are not individually redeemed from the Fund. Total Returns are calculated using the daily 4:00pm net asset value (NAV). Market price returns reflect the midpoint of the bid/ask spread as of the close of trading on the exchange where Fund shares are listed. Market price returns do not represent the returns you would receive if you traded shares at other times.
IPO ETFs vs. Market Benchmarks: IPO ETFs Underperform Amid Pressure on Growth Stocks
The Renaissance IPO ETF returned -11.4% in Q3, well below the SPDR S&P 500 ETF Trust, which returned 2.4%. While both funds were impacted by the broader macroeconomic volatility, pressure on growth stocks, particularly those with significant ties to AI, impacted the IPO ETF more severely. This resulted in a -13.8 percentage point excess return in the IPO ETF.
The Renaissance International IPO ETF returned -17.0% in Q3, well below the iShares MSCI ACWI ex US ETF, which returned -0.6%. Both funds were impacted by the broader macro volatility, and the International IPO ETF was particularly weighed down by its exposure to AI growth stocks, specifically some Japanese semiconductor names. This resulted in a -16.3 percentage point excess return in the International IPO ETF.
The IPO ETFs’ performance came with higher volatility, evidenced by higher standard deviation of daily returns during the quarter compared to the broader market benchmarks (2.0% for IPO vs. 0.7% for SPY; 1.7% for IPOS vs. 1.0% for ACWX). However, their differentiated exposure can complement broad-market strategies by capturing a distinct segment of public equities in US and international markets.
IPO ETFs vs. IPO Indices: Outcomes of Replicating Index Performance
The Renaissance IPO ETF seeks to replicate the performance of the Renaissance IPO Index, which captures newly public US-listed companies. In Q3, the IPO ETF returned -11.4%, compared to a -11.5% return for the IPO Index. The modest tracking difference of 0.01% is consistent with expectations for a passive strategy and reflects the impact of management fees, corporate actions, rebalance timing, and cash drag.
The Renaissance International IPO ETF seeks to replicate the performance of the Renaissance International IPO Index, which captures newly public internationally-listed companies. In Q3, the International IPO ETF returned -17.0%, compared to a -15.1% return for the International IPO Index. The sizable tracking difference of -1.90% reflects the expectations for a passive strategy listed above, particularly cash drag, as well as normal challenges associated with trading in international markets, particularly lot sizes that can result in over- or under-weighting.
Both funds continued to provide accurate exposure to the indices' core holdings, offering investors efficient access to the new stock asset class in both US and international markets.
Attribution Highlights
Top contributors in the Renaissance IPO ETF included beneficiaries of rallies in beaten-down spaces like software and cryptocurrency, namely data management platform Rubrik and mobile banking firm Chime. The biggest detractors were those hit hardest by the volatility in AI stocks, with chipmakers Astera Labs and Arm among the bottom names. In its third quarterly rebalance of the year, nine names were added to the IPO ETF, including SpaceX and Korean memory chip maker SK hynix.
Top contributors in the Renaissance International IPO ETF were Chinese gold miner Zijin Gold, which surged on strong earnings, and Chinese appliance manufacturer Midea Group, driven in part by expansion initiatives and strong seasonal demand. The biggest detractors included Japanese semiconductor firms Kioxia and Kokusai Electric. In its third quarterly rebalance of the year, six Hong Kong-listed names were added to the International IPO ETF, including AI tech supplier Zhongji Innolight and LLM developer Zhipu AI.
The IPO ETFs aim to offer a systematic investment approach, novel diversification, and dynamic access to the transformative period post-IPO. We believe that the defined three-year holding period makes these the go-to ETFs for investors interested in new stocks, as they include names not found in most core portfolios.
Investors interested in the ETF can access fact sheets, performance data, and holdings on our website, or contact our team for further information.
Investments in the Renaissance IPO ETF, symbol “IPO”, and the Renaissance International IPO ETF, symbol “IPOS” (the “ETFs”) are subject to investment risk, including possible loss of the principal amounts invested. The ETFs invest in companies that have recently completed initial public offerings. These stocks are unseasoned equities lacking trading history, a track record of reporting to investors and widely available research coverage which may result in extreme price volatility. Due to a greater number of IPOs in certain segments, the ETFs may also be subject to information technology and financial sector risk, small and mid-capitalization company risk, and, for the Renaissance International IPO ETF, emerging market risk. The ETFs may hold securities in the form of Depository Receipts, REITs, and Partnership Units, which have greater risks than common shares. The strategies have high portfolio turnover and securities lending risks. The returns of the ETFs may not match the return of the respective indices. The ETFs are classified as non-diversified investment companies subject to concentration risk.
For a prospectus and/or summary prospectus with this and other information, please visit the document center at etfs.renaissancecapital.com. Investors should read the prospectus and consider the investment objectives, risks, charges and expenses carefully before investing.
Companies mentioned in this article may be held by the funds. For a list of the Renaissance IPO ETF’s top 10 holdings, please click here. For a list of the Renaissance International IPO ETF’s top 10 holdings, please click here. Fund holdings are subject to change.
Foreside Fund Services, LLC, is the distributor for the ETFs. For additional information, contact Foreside at 1-866-486-6645.
Definitions
The Renaissance IPO Index (IPOUSA) is a portfolio of companies that have recently completed an initial public offering and are listed on a US exchange. The Renaissance International IPO Index (IPOXUS) is a portfolio of companies that have recently completed an initial public offering and are listed on a non-US exchange.
Excess Return is the difference between the return of a portfolio and the return of a specified benchmark over a given period. A positive excess return indicates outperformance over a specified benchmark. Tracking Difference is the difference between the return of a portfolio and the return of its underlying index over a given period. Net Asset Value (NAV) of the fund is calculated by dividing the total value of all the securities in its portfolio, less any liabilities, by the number of fund shares outstanding. Market Price is the current value at which an asset or service can be bought or sold. Standard Deviation of returns measures the average a return series deviates from its mean. It is often used as a measure of risk. When a fund has a high standard deviation, the predicted range of performance implies greater volatility.