In a study of 1,494 US IPOs spanning 30 years, LPL Research found that the average one-year return measured from the first-day close was +10.4%. The median return for the same period was -4.7%.1
Both figures are correct, and the contradiction is the starting point for understanding the new stock asset class.
Most new stocks are unremarkable investments. A small number can become extraordinary winners. The result is a market where the typical outcome and the collective opportunity can look very different.
To understand what this means for investors, we'll examine the forces behind IPO return dispersion, why capturing the biggest winners is so difficult, and how diversification can help address those challenges. The result is a framework for evaluating new stocks as a distinct segment of the equity market and considering where systematic exposure may fit within a broader portfolio.
A distribution with two interpretations
Our analysis of 451 US IPOs that raised at least $100 million from 2021 through 2025 shows an even sharper divide. Measured from the offer price through October 30, 2026, the median stock was down -27.3%, while the simple average return was +4.0%. Two-thirds of the companies traded below their offer prices.
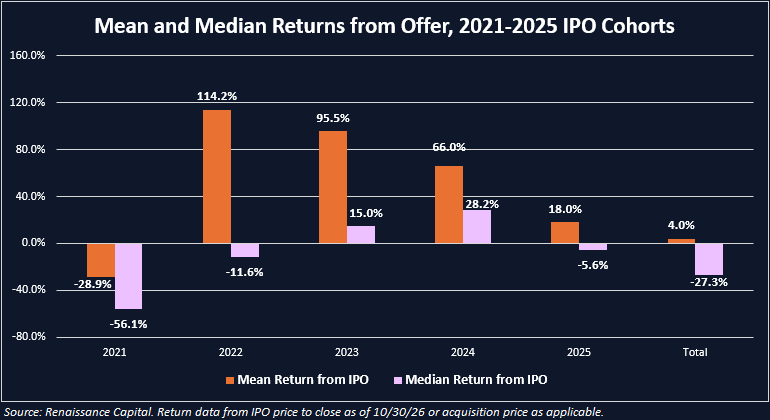
Those are cumulative returns across IPO vintages of different ages, not a backtest of an investable portfolio. The sample also spans one of the most challenging periods for new stocks in recent history and includes a high proportion of deals from 2021 (276 IPOs). However, the pattern is revealing. Remove the ten biggest winners, which accounts for just 2% of the sample, and the average return of the remaining 441 stocks falls to -11.2%.
There are two ways to read those numbers. One is to conclude that IPO investing is an unfavorable bet with too many losers, too few winners. The other is to recognize a highly asymmetric distribution, where missing a handful of successes can substantially change the result.
A stock can lose no more than 100% of its value, but its upside has no corresponding limit. If a single stock in an equal-dollar portfolio were to increase tenfold, that could mathematically offset nine complete losses. This is a simplified example, but it illustrates the challenge of investing, particularly in stocks with no history: avoiding the losers while also being present for the winners without knowing their identities in advance.
Where mispricing can emerge
Periods of dislocation created by the IPO process itself is another reason to look past the first-day headlines.
At listing, supply is often tightly constrained. In our 2021-2025 sample, the median initial free float was approximately 16%. Limited shares available for trading can magnify demand, particularly when investors are eager to own a new technology or a familiar consumer brand.
Then the dynamics reverse. Lockups often expire around six months after listing, allowing early shareholders to sell. Launch publicity fades, and companies without extensive institutional coverage, established profitability, or eligibility for major indexes may struggle to find a new natural buyer just as supply increases.
A broad market selloff can deepen the problem. IPOs tend to arrive in waves, so companies that priced during a period of euphoria may be repriced together when sentiment changes, even though business quality can still differ greatly within those groups.
Consider 2025. A rally through the spring led to a strong summer market, followed by a tightening in the fall. Figma rose +250% on its opening day that July; Navan fell -20% when it listed in October. Both were high-growth software companies, but they went public into very different markets.
Across the 71 sizable 2025 IPOs in our sample, the average first-day gain was +24.8%. Yet by October 2026, the median aftermarket return, or the return from the first day closing price, was -2.4%. The contrast illustrates that strong first-day performance does not necessarily translate into positive aftermarket returns.
These forces can leave promising businesses temporarily overlooked. A falling price is not often considered evidence of value, but one related to a valuation reset, lockup expiration, or disappointing initial quarter may create an attractive entry point.
Why finding the bargains is harder than it looks
While an IPO’s offer price holds significance, it is a historical transaction, not a measure of intrinsic value. An IPO below its offer price may look cheap. It may also mean the company is burning cash faster than expected, facing dilution, or discovering that its addressable market was overestimated. Even when valuations appear attractive, the timing of a potential recovery remains uncertain.
There is also a practical problem. By the time an overlooked IPO looks interesting, trading liquidity may have deteriorated. Thin trading can increase transaction costs and make it difficult to establish or exit a meaningful position without moving the stock’s price.
Vintages create another layer of risk. In our data, the median one-year return for the 2021 class was -47.9%; for the 2024 class it was +8.5%. Buying a few companies from an embattled issuance window can overwhelm otherwise sensible stock selection.
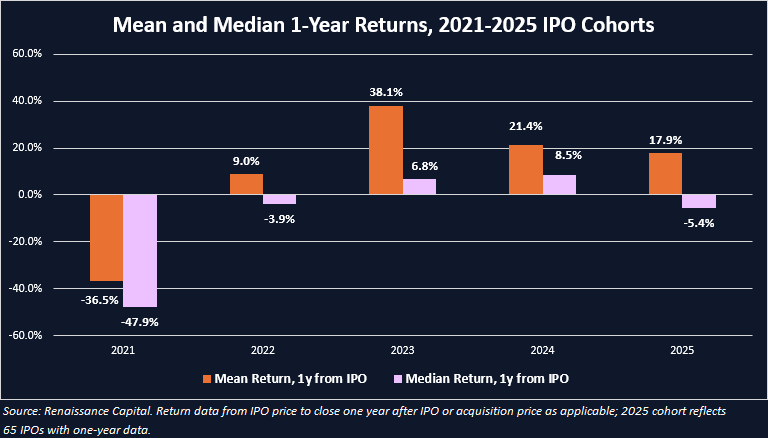
While there is clear opportunity, it’s neither uniformly distributed nor easy to extract through concentrated bets.
The case for breadth and the right weighting
For an investor attempting to capture the category rather than forecast individual winners, diversification plays an important role. It may help cushion a bad pick while also increasing the likelihood of maintaining exposure to the small set of companies that ultimately account for a disproportionate share of returns.
The data makes the point clearly: Ten stocks changed the average cumulative outcome of our 451-company sample from a gain to a loss. If investors rely on stock picking in the new stock asset class, they may never hold one of those companies.
Weighting matters as much as the number of holdings. A float-adjusted market capitalization approach directs more capital toward larger, more tradable companies, rather than treating a thinly-traded, speculative listing like an established multibillion-dollar issuer. As businesses gain value, their portfolio influence can rise, subject to rebalancing rules and concentration limits.
This is not the same as buying all 451 stocks equally at their offer prices. It also does not eliminate broader market drawdowns or assure outperformance. Instead, it offers a disciplined method of seeking exposure to an unusually uneven opportunity set.
The exposure most investors may be missing
Many investors may assume that broad market funds already provide meaningful exposure to the largest, most liquid newly public companies. Often, they do not.
The S&P 500 generally requires at least 12 months of public trading before considering an IPO, along with size, liquidity, and profitability tests. Some other benchmarks now have accelerated entry paths for exceptionally large new listings, but inclusion is neither immediate nor universal.
Investors who rely entirely on established benchmarks can spend the formative public years of an emerging leader with little or no direct exposure.
A systematic way to participate
The Renaissance IPO ETF (NYSE: IPO) aims to fill that gap. As of September 30, 2026, it had no overlap with the S&P 500.
The Renaissance IPO ETF seeks to track the Renaissance IPO Index, which targets roughly 80% of the market capitalization of eligible newly public companies, subject to size, float, and liquidity requirements. The Index is rebalanced quarterly and removes companies after three years in the public market. It weights constituents using float-adjusted market capitalization, with a 10% cap applied at rebalancing.
The IPO ETF’s approach is designed to provide diversified, rules-based access to newly public companies during a stage when they are often missing from traditional equity benchmarks.
Conclusion
The median IPO’s poor record should make investors cautious, but our data shows that it should not end the discussion. In a market where a few exceptional businesses can matter enormously, investors may find themselves asking whether every new stock deserves a place in a portfolio. The more useful question is whether they have a sensible way to own enough of the opportunity to avoid missing what matters.
Investments in the Renaissance IPO ETF, symbol “IPO”, are subject to investment risk, including possible loss of the principal amounts invested. The ETF invests in companies that have recently completed initial public offerings. These stocks are unseasoned equities lacking trading history, a track record of reporting to investors and widely available research coverage which may result in extreme price volatility. Due to a greater number of IPOs in certain segments, the ETF may also be subject to information technology and financial sector risk, and small and mid-capitalization company risk. The ETF may hold securities in the form of Depository Receipts, REITs, and Partnership Units, which have greater risks than common shares. The strategies have high portfolio turnover and securities lending risks. The returns of the ETF may not match the return of the index. The ETF is classified as non-diversified investment companies subject to concentration risk. Diversification does not guarantee a profit or protect against a loss.
For a prospectus and/or summary prospectus with this and other information, please visit the document center at etfs.renaissancecapital.com. Investors should read the prospectus and consider the investment objectives, risks, charges and expenses carefully before investing.
Companies mentioned in this article may be held by the funds. For a list of the Renaissance IPO ETF’s top 10 holdings, please click here. Fund holdings are subject to change.
Foreside Fund Services, LLC, is the distributor for the ETFs. For additional information, contact Foreside at 1-866-486-6645.
1 Source: LPL Research, "Introducing the IPO Class of 2026" (June 15, 2026). Analysis based on 1,494 IPOs raising at least $50 million from April 1995 through April 2025. One-year returns are measured from the closing price on the first trading day. Underlying data: LPL Research and Bloomberg, June 3, 2026.